
Sustainable operations
We are working to improve our practices by measuring and seeking to reduce our carbon footprint at different stages of our bottle life cycle, including materials, production, bottling, transportation and recycling.
Our actions
Transport
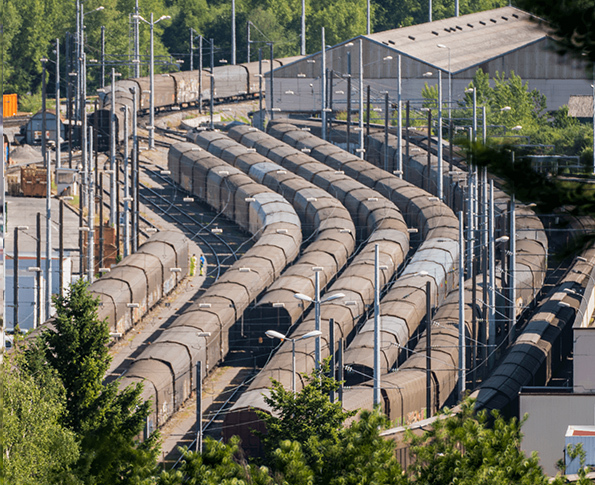
We aim to better manage our carbon footprint and are exploring ways to improve efficiency. For example, we have an historical railway station in the factory, and knowing that train transportation carbon footprint is smaller than trucks, in 2025 almost 1 bottles out of 2 is shipped by train*.
*internal data July 2026
Packaging
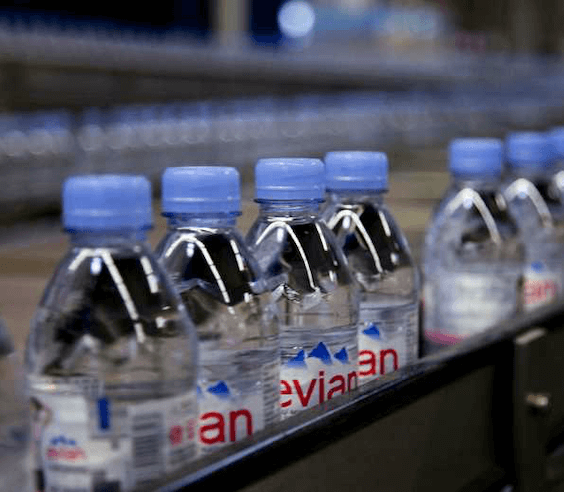
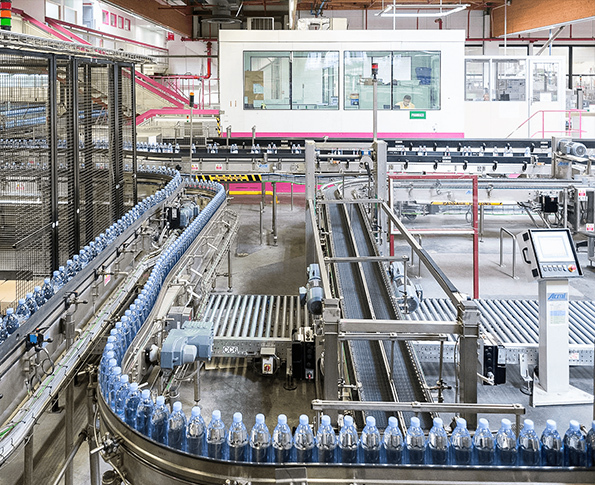
Using recycled PET instead of virgin PET reduces carbon emissions by 30% for the packaging and end-of-life stages of an evian bottle, and by 15% across the product’s full life cycle.
In 2026, around 85%* of evian bottles placed on the market are made from recycled PET, including all bottles sold in Europe, the United States and Canada.
Increasing recycled content remains a key part of our approach, alongside designing bottles for recyclability and supporting effective collection and recycling systems.
We believe circularity requires collective action across the entire value chain. This includes improving collection, sorting and recycling infrastructure and supporting solutions such as Deposit Return Systems (DRS), which help recover high-quality materials that can be recycled into new bottles.
Our ambition remains unchanged: to help advance a more circular model where materials stay in use for longer and are kept out of nature.
(*internal data –July 2026)
Our bottling site runs on 100% renewable energy generated from various sources:
Electricity
It can be generated from wind power, solar panels or hydro power.
Wind power: The wind turns turbines that generate electricity
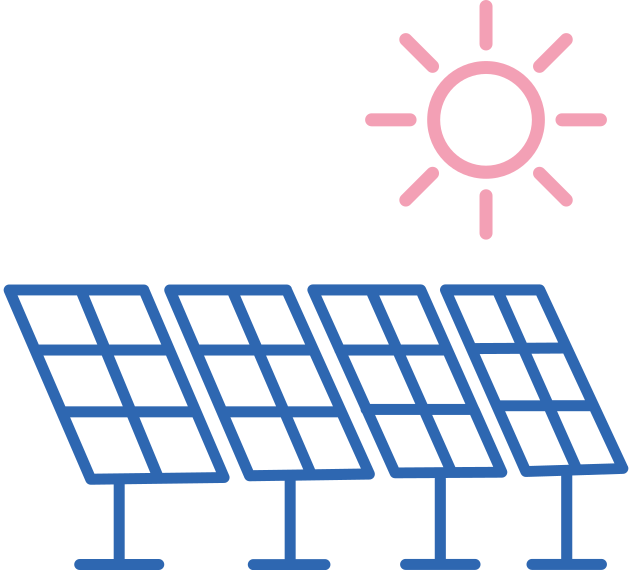
Solar power: Solar panels convert sunlight into electricity
Hydro power: Flowing water turns turbines that generate electricity
Biogas: It is composed of methane produced by the breakdown of organic matter, such as agricultural waste, manure, plant material, sewage, green waste or food waste
Production
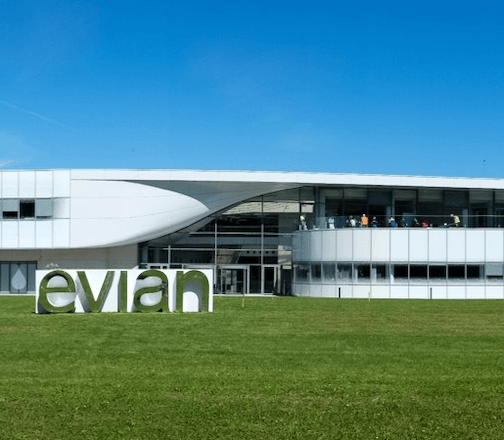
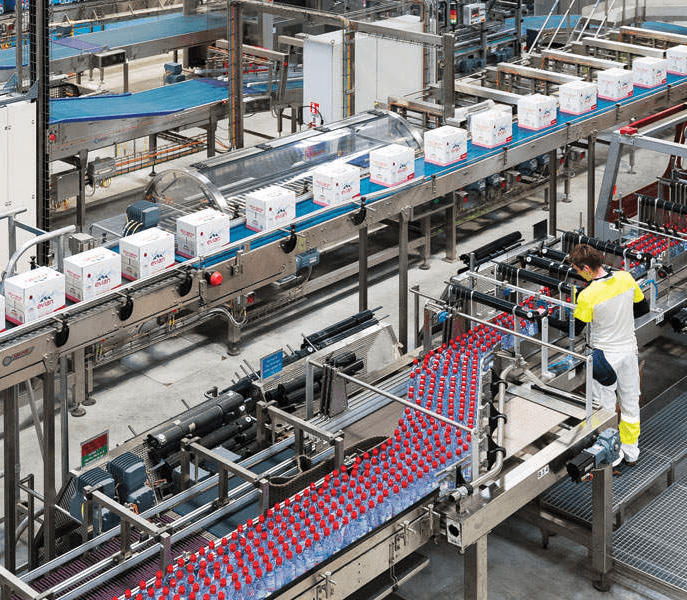
- Our factory is where evian natural mineral water is bottled. It is also the place where we develop new packaging and production approaches to improve resource use and contribute to our circularity objectives over time.
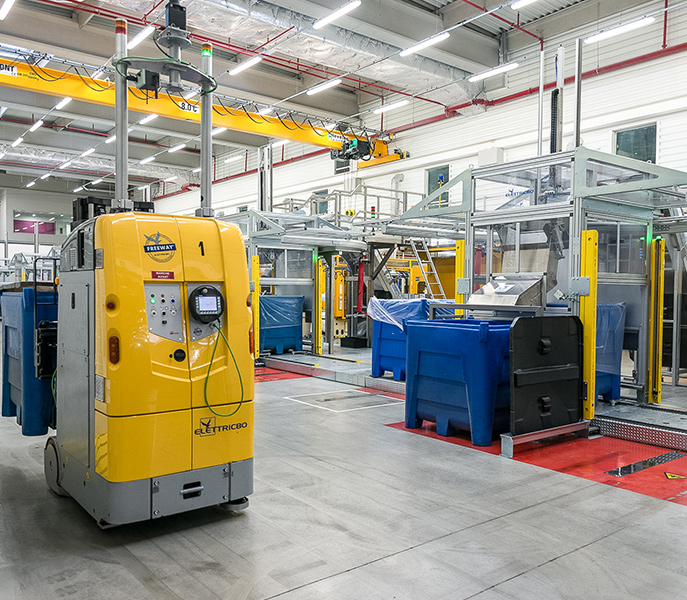
- At our bottle site, management systems have been developed to support efficiency improvements.
Between 2010 and 2025, measured energy consumption per bottle* decreased by 40% and the water use in operations by 50% since 2008. These changes are associated with multiple projects managed by a dedicated team focused on monitoring energy and water use and identifying improvement opportunities.
*( kWH/1000 bottles)
How to reduce our plant consumptions:
Energy
- we are certified ISO 50001 since 2015 (certifcationof energy consumption management)
- All machines have been equipedwith energy meters that enable real-time monitoring of consumption and help identify anomalies.
- We issue weekly reports of energy consumption and optimization
- Our employees are trained on energy, waste and water consumption reduction, carbon footprint
Water in operations
- The water used to irrigate our green spaces comes from rainwater collected from rooftops.
- Lawn irrigation is carried out only at night.
- Mapping our industrial water meters and automatically collecting real-time data to optimize monitoring and management.
- Encourage employees’ initiatives. For example, some automatic water-activated devices have been replaced with foot pedals, helping to reduce industrial water consumption across the site.